Scratch Golfer vs Tour Pro: What Separates the Best in Golf
The Science Behind Scratch Golfers and Tour Professionals: A Comparative Performance Analysis
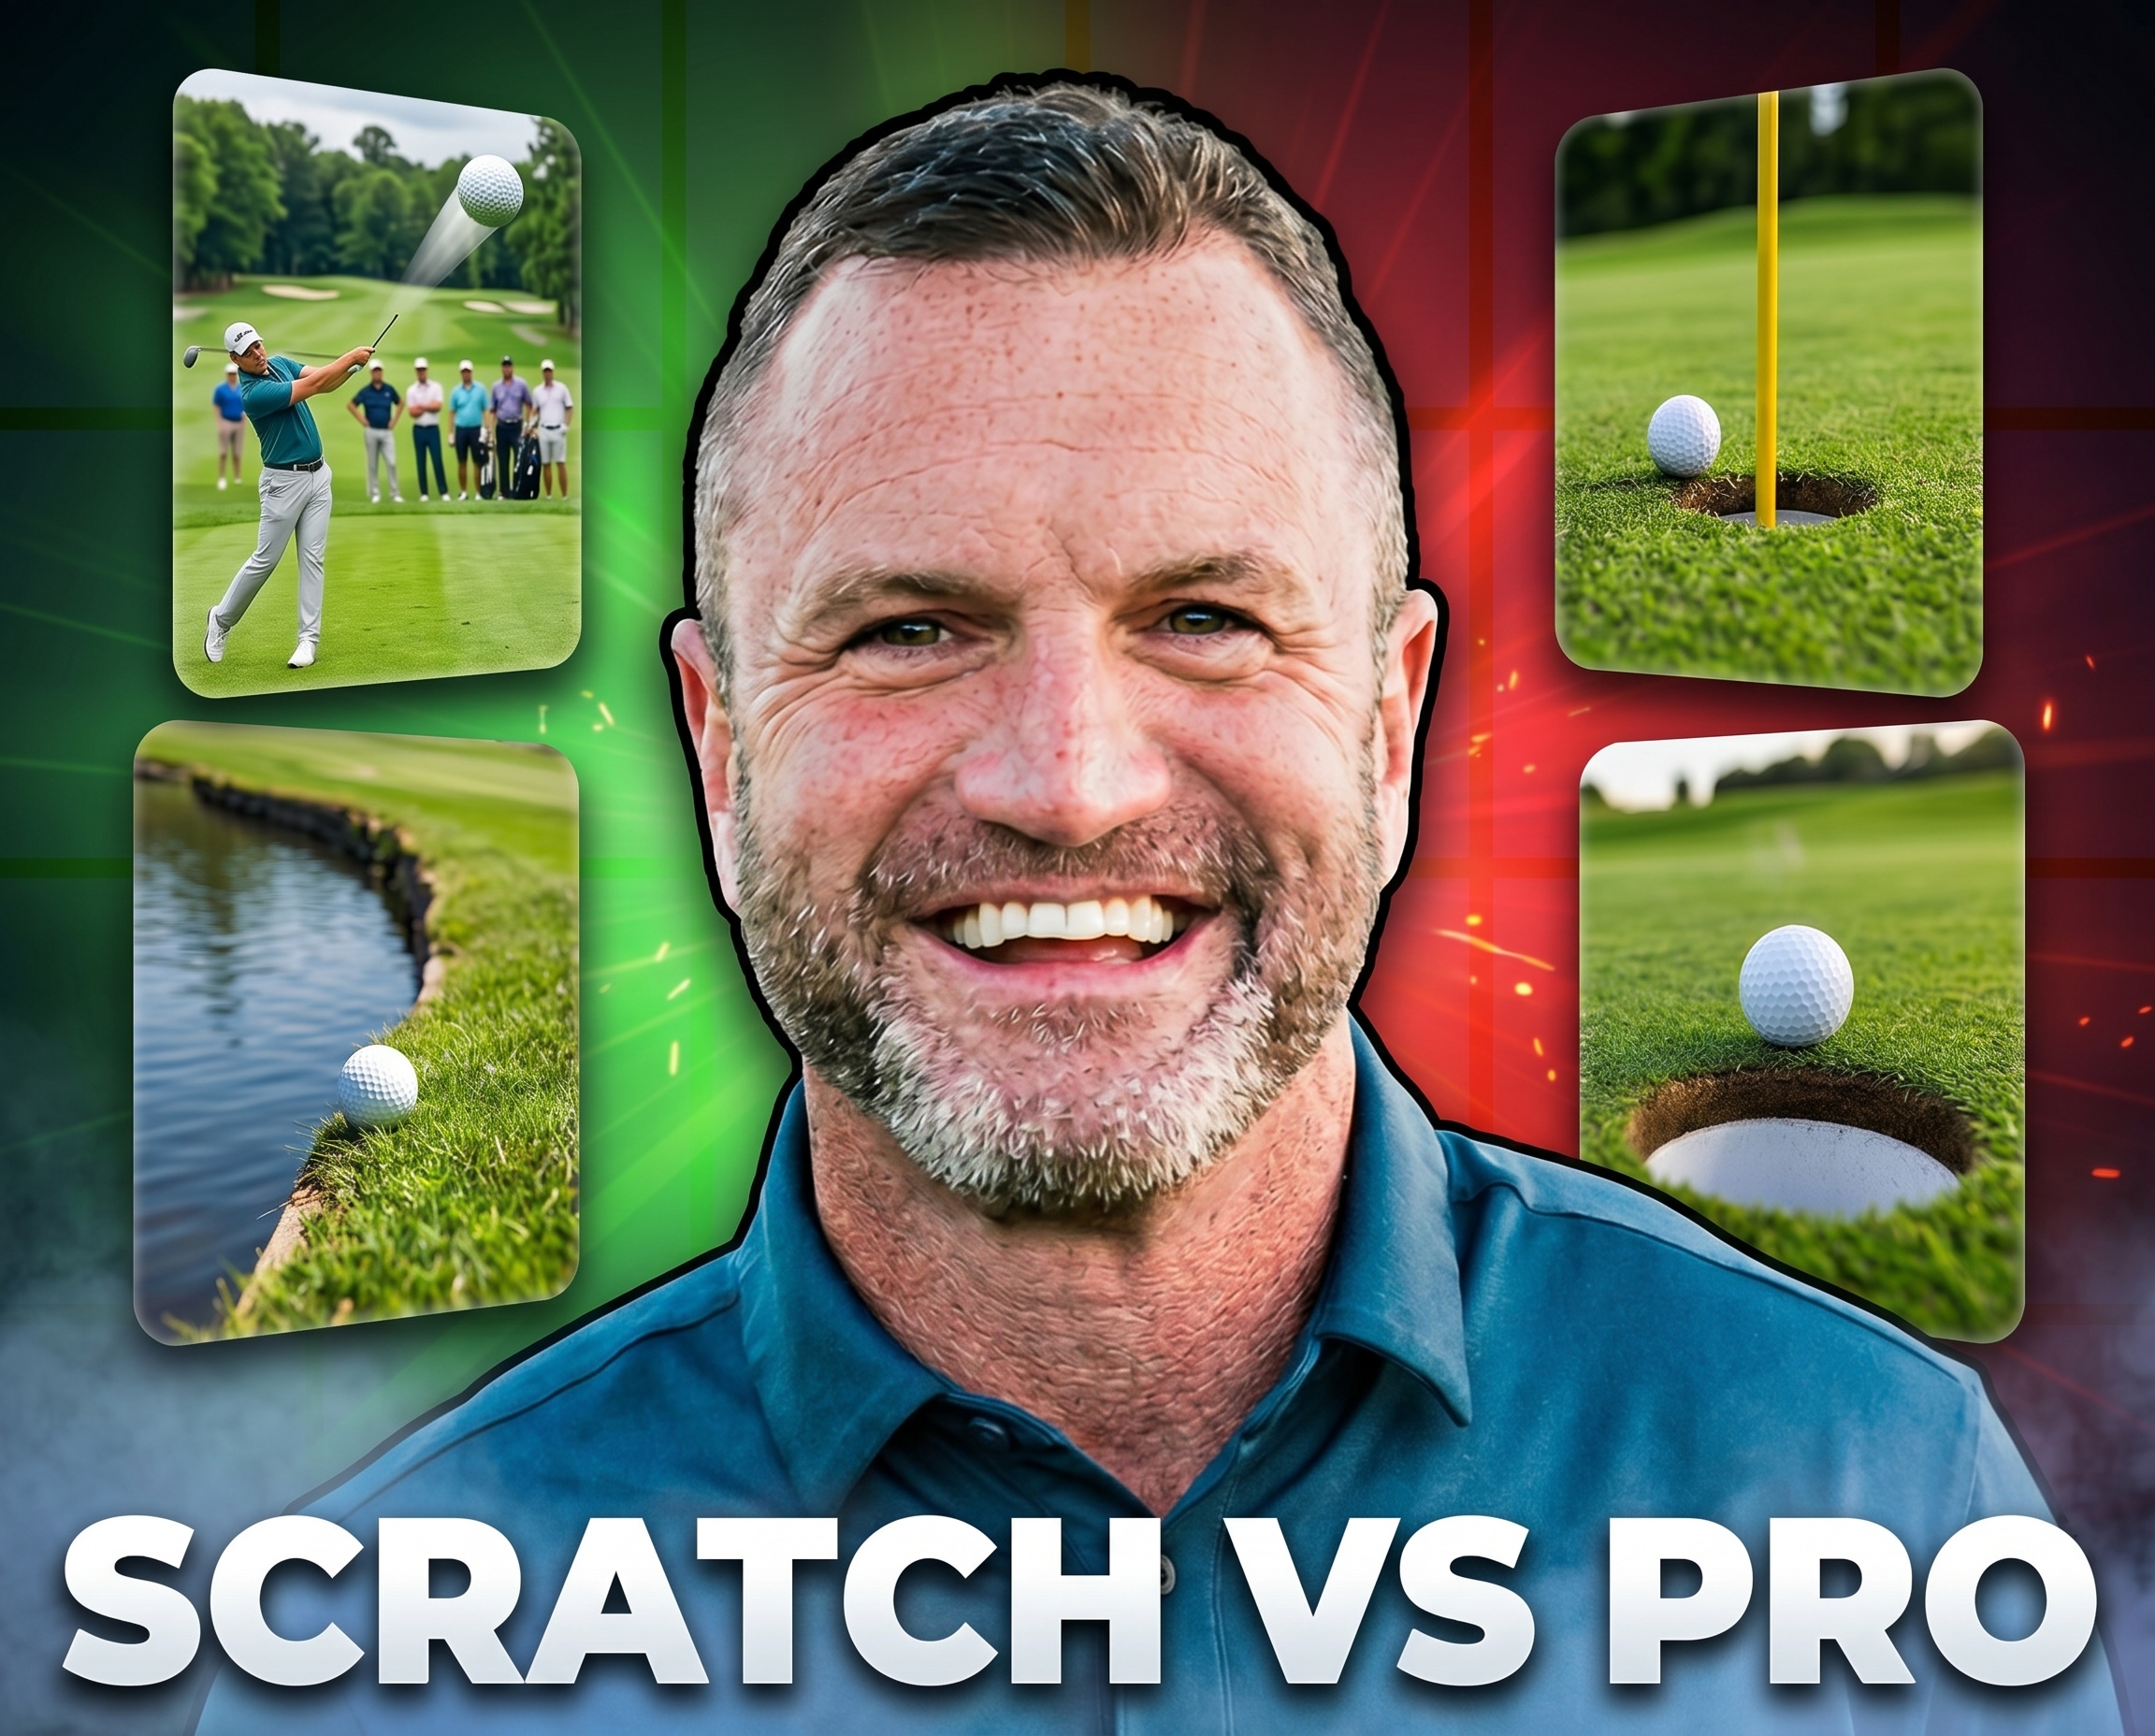
Hi friends and golfers. My name is coach Erik Schjolberg, founder and owner of EJS Golf and the Science of Better Golf community. You can find me teaching live at McCormick Ranch golf course located in Scottsdale, AZ. Having coached thousands of lessons over the past 25 years plus, I have learned that the more golfers focus on data and what is real vs. feels or imagined, the better they get. This is a super important topic that you are going to read and learn about today. Check out my most recent blog where I analyze golfers at 100, 90. 80 and 70 and how to make the jump to the next level.
Let me be clear: shooting scratch is an impressive accomplishment. But being a scratch golfer does not mean you’re playing at a professional level. My entire coaching framework at EJSGolf.com, and the educational resources insideThe Science of Better Golf are based on this very principle—understanding the quantifiable performance differences between scratch golfers, PGA Tour players, and LPGA professionals. These gaps are not just theoretical—they are grounded in data and biomechanical truths. Once you understand them, you can begin to train toward them with precision.
This article outlines those performance differentials through six critical skill domains: Driving, Penalty Avoidance, Greens in Regulation (GIR), Approach Play, Short Game (Scrambling and Sand Saves), and Putting. We’ll conclude with statistical visualizations that clarify these distinctions.

Driving: Combining Distance with Precision
Scratch golfers typically average 260 yards off the tee and hit approximately 50% of fairways. Respectable, but insufficient at the professional level. PGA Tour players average over 300 yards, while LPGA professionals average closer to 253 yards—but with a significantly higher fairway accuracy of 70–75%.
This superior positional play leads to better scoring opportunities. LPGA players, despite similar driving distances to scratch golfers, start each hole from far more favorable angles and lies due to their consistency.
Penalty Avoidance: Minimizing the Invisible Threat
Penalty strokes are one of the most overlooked areas where scratch golfers lose strokes. A scratch player may incur 1–2 penalty strokes per round, often from OB drives, hazards, or recovery situations.
Tour professionals excel at managing dispersion and shot selection to avoid these costly mistakes. Their edge is less about elite power and more about decision-making, course management, and technical consistency—all of which are central to my instruction at EJS Golf.
Greens in Regulation (GIR): The Foundation of Scoring
Scratch players hit approximately 10–11 greens per round. PGA Tour pros average 12–13. LPGA pros often exceed that, hitting as many as 13–14 greens in regulation.
That seemingly small gap translates into major scoring advantages: more birdie opportunities, fewer recovery situations, and less reliance on scrambling.
Players who consistently break 80 understand this intuitively. Players looking to break par must train to match the consistency of Tour-level approach patterns, particularly from 100–175 yards. In The Science of Better Golf, we develop this through structured yardage controls, launch windows, and dispersion feedback.
Approach Play: Precision That Pays Off
The true separation begins with proximity. From 125–150 yards, Tour players often average inside 30 feet to the hole. Scratch golfers? Often over 40 feet.
That gap has direct scoring consequences. Tour professionals convert more birdies not because they are better putters per se, but because their birdie putts begin from makeable distances.
In our coaching sessions at EJS Golf, we integrate shot dispersion patterns, distance control drills, and biomechanics to close this gap.
Short Game: Scrambling and Sand Save Efficiency
When greens are missed, the ability to recover becomes critical. Scratch golfers successfully scramble around 50–55% of the time. PGA Tour pros exceed 58%. LPGA players generally sit between 55–60%.
Even in bunker scenarios, pros save par more often. Scratch players average about 44% in sand saves, compared to 49% on the PGA Tour and about 45% on the LPGA Tour.
While these differences may appear marginal, over 18 or 72 holes, they become highly consequential. These are trainable skills. Inside The Science of Better Golf, we provide shot decision models and short game progressions designed to address exactly this.
Putting: Eliminating the Cost of Inconsistency
On paper, scratch golfers average about 30.7 putts per round. PGA pros? Closer to 29. LPGA pros land around 30. The difference may seem negligible—until you account for distance-specific make percentages and 3-putt avoidance.
From 10 feet, scratch players make roughly 17% of putts. PGA Tour pros approach 30%. That alone creates a 1–2 stroke advantage over 18 holes.
Inside EJS Golf, we teach players how to construct a putting game around measurable skills: distance control, pressure putt execution, and make-zone optimization. Repetition is not the answer—structure is.
Scoring Consistency: Birdies, Bogeys, and the Cost of Mistakes
Scratch golfers average 4–5 bogeys and approximately one double bogey per round. PGA Tour pros average only 2.7 bogeys and rarely make doubles. LPGA pros are similar, averaging about 3.3 bogeys per round.
In terms of birdies, scratch golfers average around 2 per round. PGA Tour pros make nearly 4. LPGA pros come in around 3.5. Again, it’s not talent—it’s consistency and risk management.
At The Science of Better Golf, our system is built to engineer these outcomes with purpose: predictable scoring windows, reduced error margins, and smarter round management.
Final Synthesis: Scratch Isn’t the Summit
Even par is an outstanding benchmark, but it is not professional-grade performance. Tour professionals operate at a fundamentally higher level—not due to extraordinary gifts, but due to better systems, superior structure, and more refined skill application.
My approach to coaching is grounded in biomechanics, physics, and data feedback. I don’t believe in vague tips. I believe in cause-effect systems that players can measure, repeat, and master.
✅ Ready to elevate your performance? Start at EJSGolf.com
✅ Join our data-driven community at TheScienceOfBetterGolf.com
Now you know what separates scratch players from professionals. Let’s close the gap—systematically, scientifically, and with intent.
[Performance Summary Chart]
Driving Distance: Scratch – 260 yds | LPGA – 253 yds | PGA – 300 yds
GIR: Scratch – 56% | LPGA – 73% | PGA – 66%
Scrambling: Scratch – ~52% | LPGA – ~57% | PGA – ~58%
Putting (3-Putts): Scratch – 1.3 | LPGA – ~0.6 | PGA – ~0.5
Birdies per Round: Scratch – 2 | LPGA – ~3.5 | PGA – ~3.7
(480) 861-9370
